What-if Analysis
What-if analysis is a predictive analysis method used to evaluate the impact of changes in specific variables under different assumptions or scenarios.
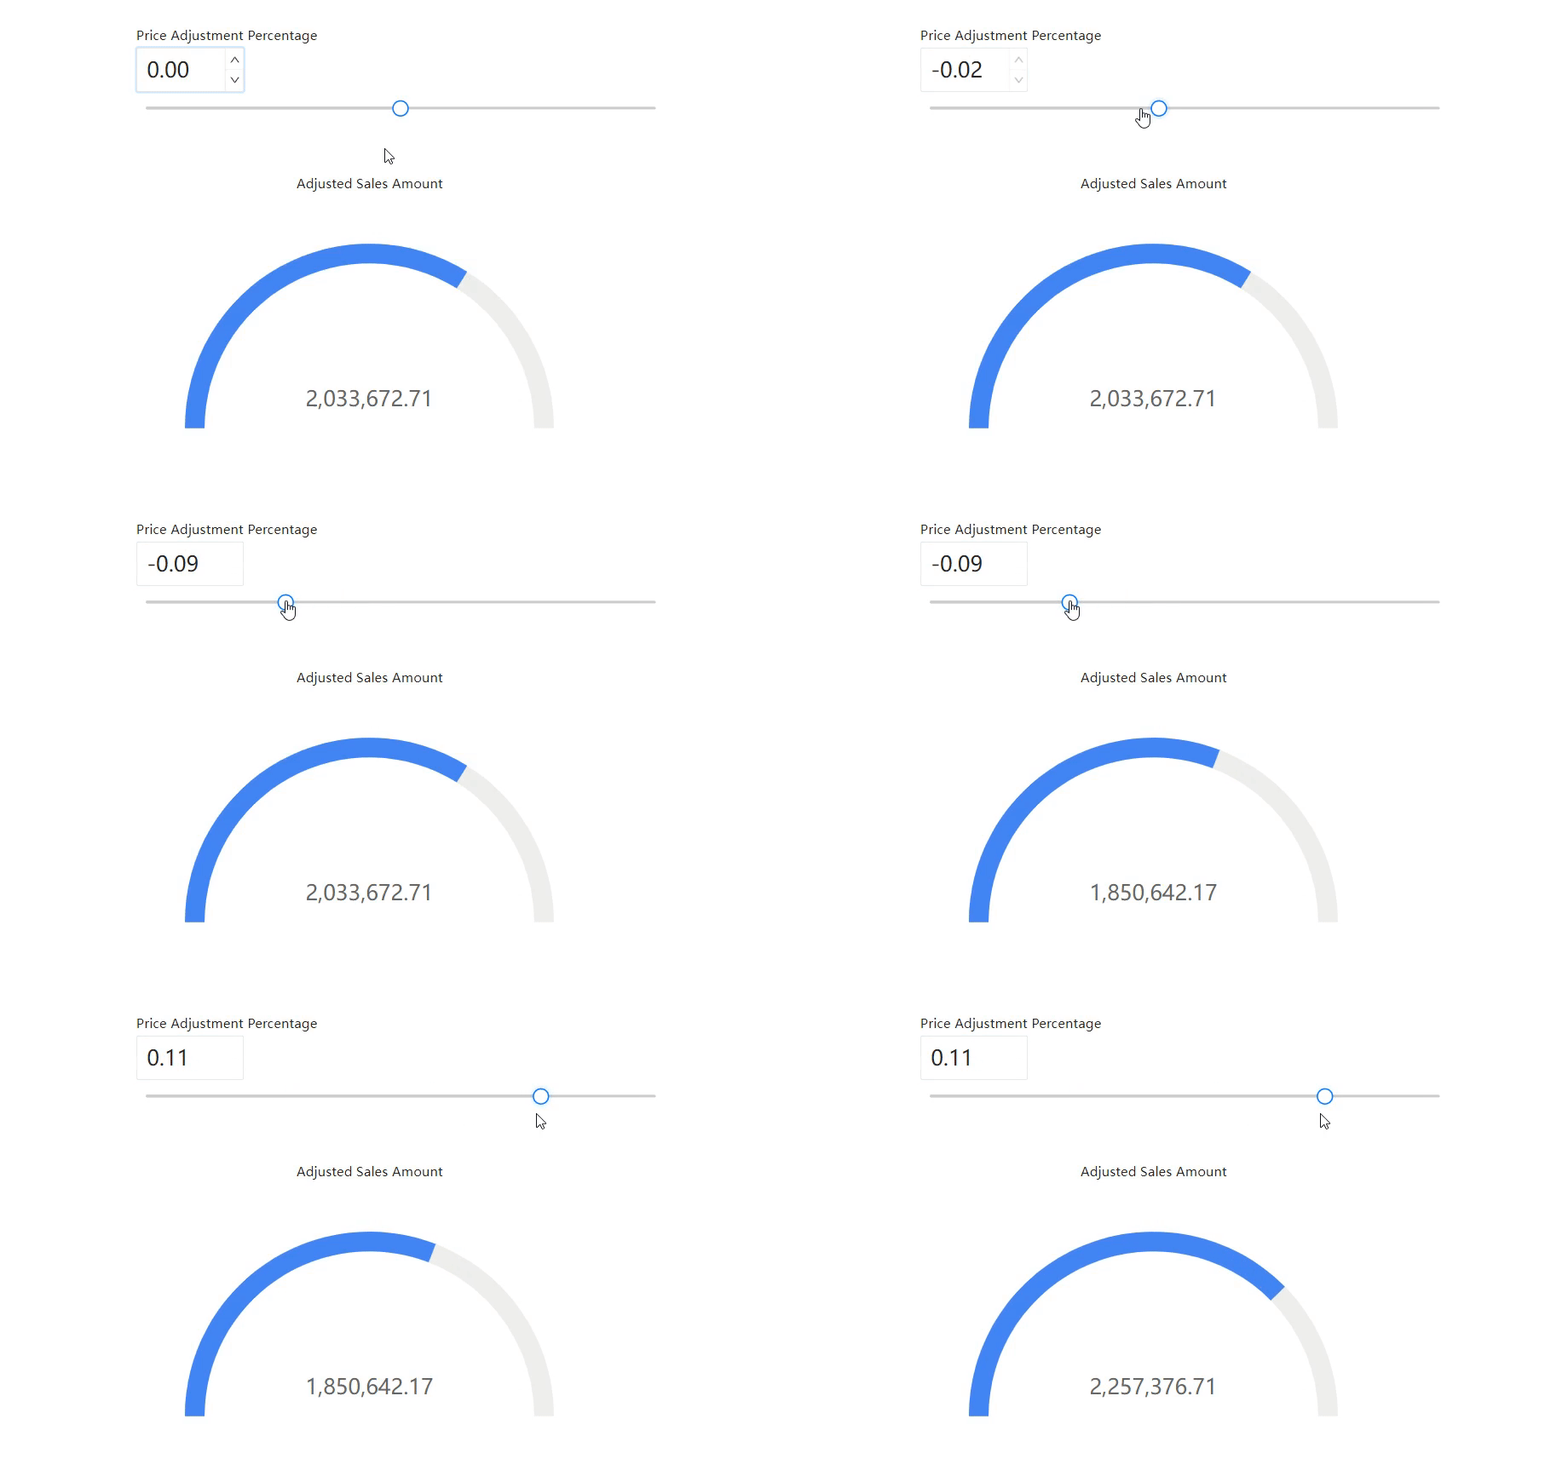
Below is a detailed example demonstrating how to use What-If parameters in Datafor for sales forecast analysis:
Scenario: Sales Forecast Analysis
Background
A retail company wants to forecast the impact of different pricing strategies on future sales revenue. They aim to understand how adjusting product prices will affect sales quantities and total revenue.
Objective
Use Datafor's What-If parameter feature to simulate the impact of different price adjustment scenarios on sales revenue.
Steps
Create a Parameter Controller
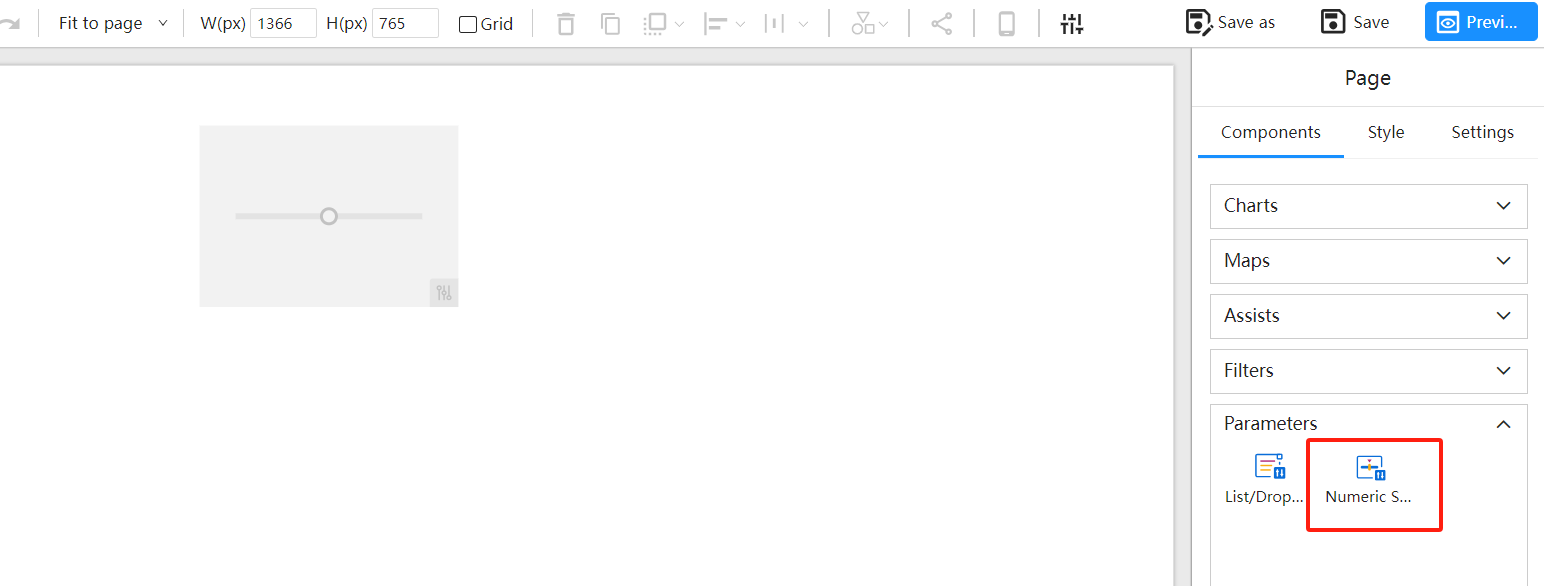
Create What-If Parameter
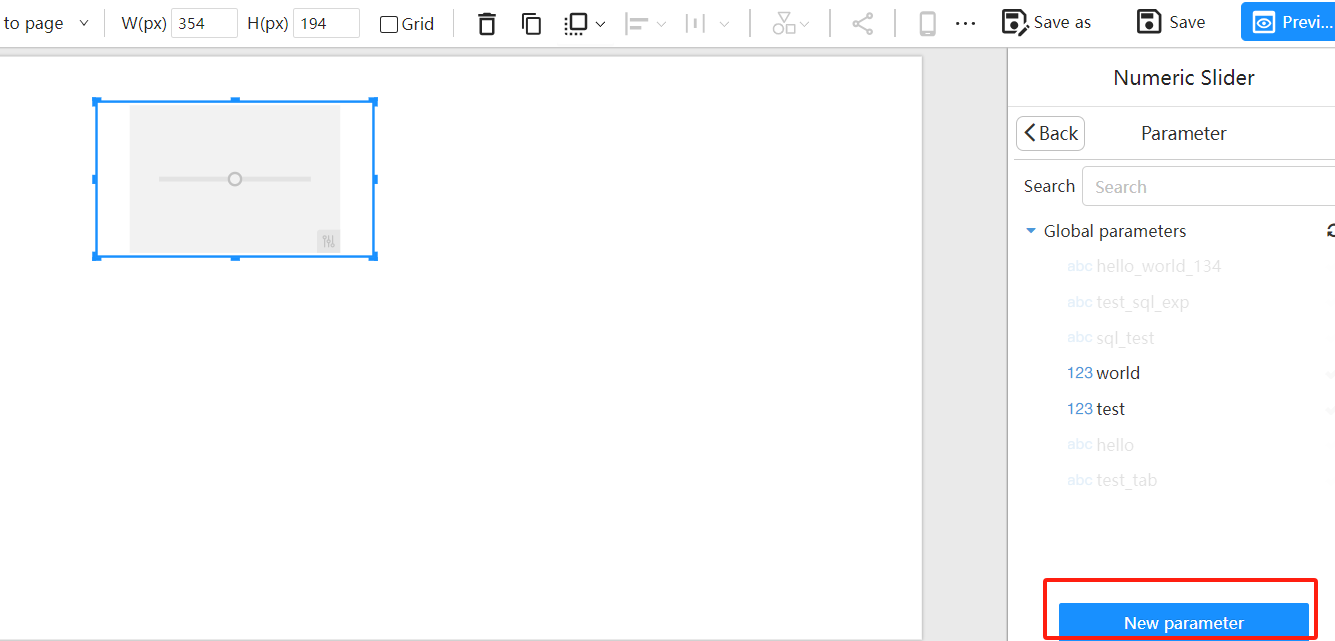
- Select the parameter controller, click the "Add Data" button in the data panel, and choose "New Parameter".
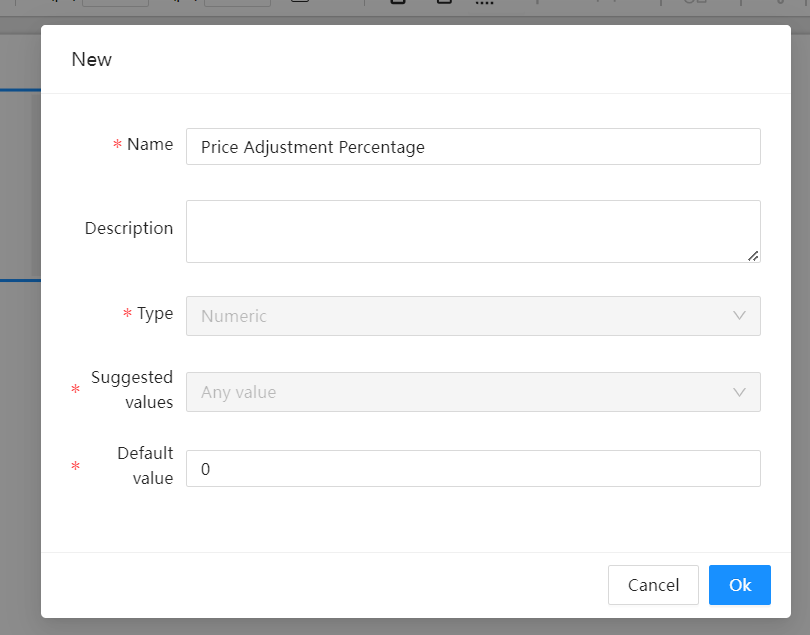
- Name the parameter "Price Adjustment Percentage" with a default value of "0".
- Select the created "Price Adjustment Percentage" parameter.

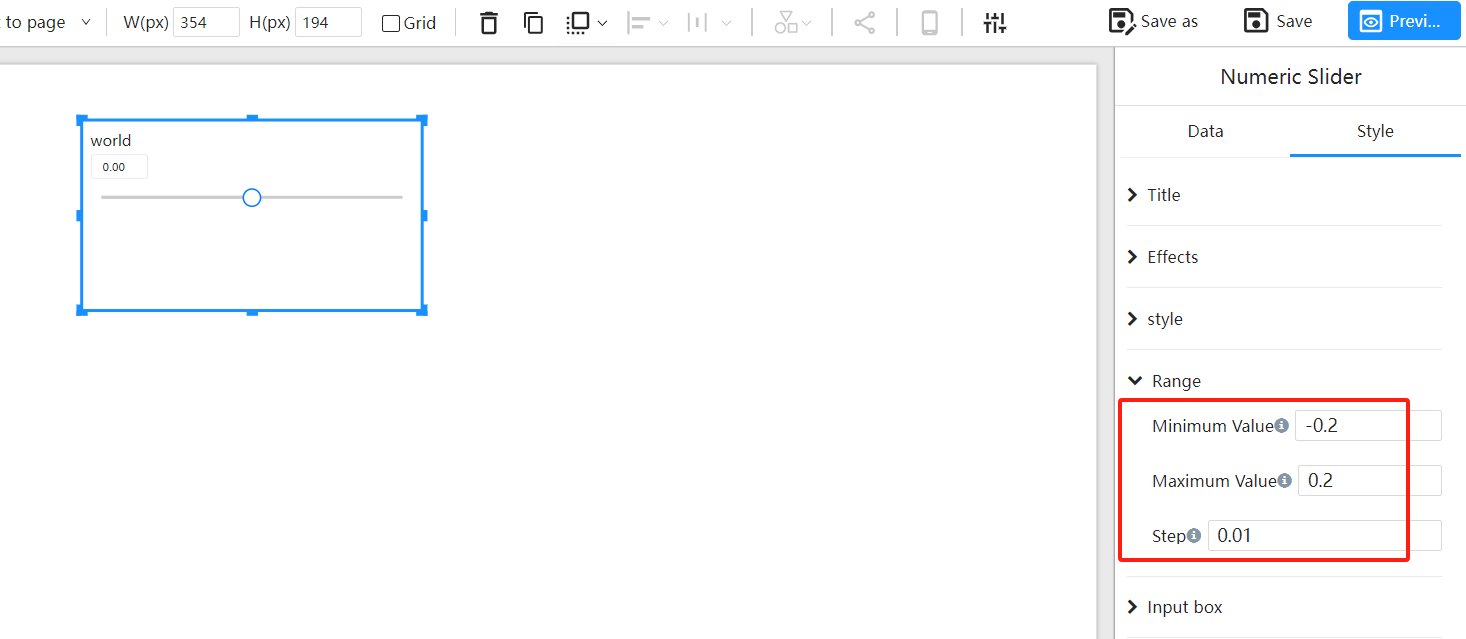
- Define the slider's value range in the style panel, with a minimum of -0.2, maximum of 0.2, and a step size of 0.01.
Create a Gauge Component
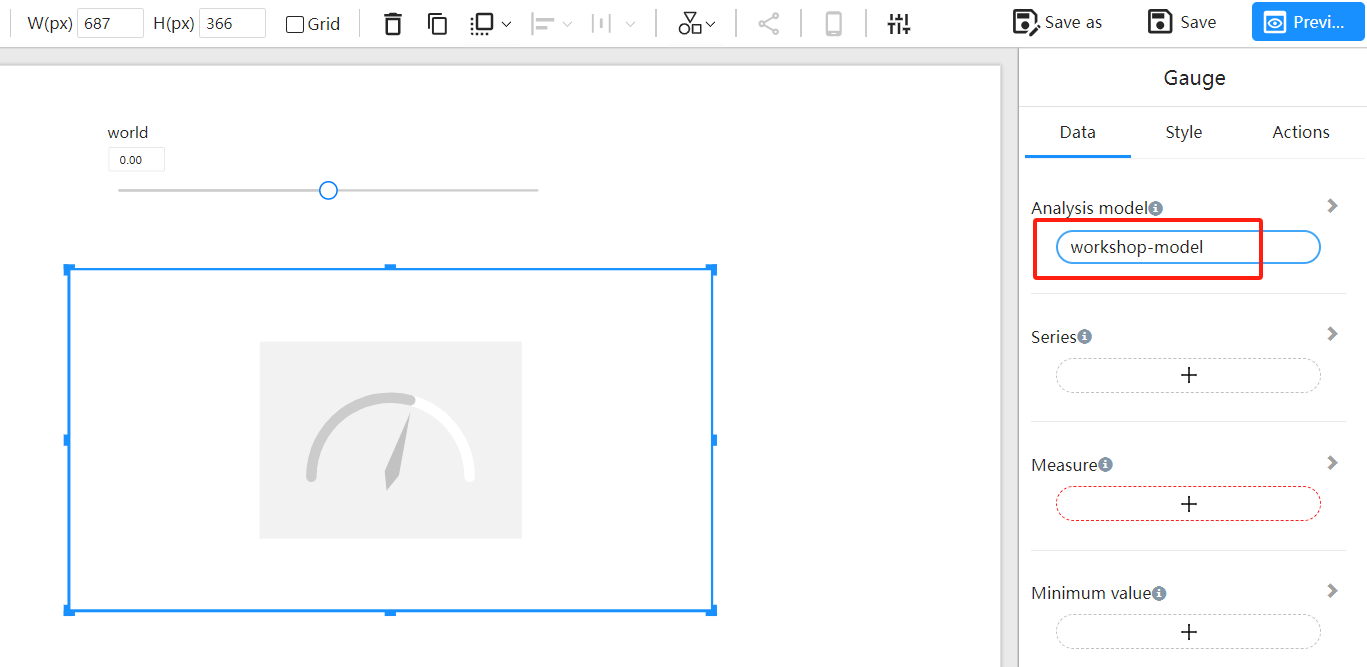
Select the analysis model "workshop-model".
Add Measures
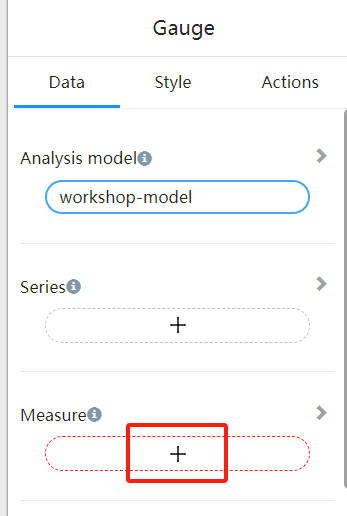
In the data panel, click the "Add Data" button.
Create Calculated Measures
.png)
Measure Name: Adjusted Price
Formula:
[Measures].[sales_fact.UNIT_PRICE] * (1 + ParamRef("Price Adjustment Percentage"))Measure Name: Adjusted Sales Amount
Formula:
[Measures].[sales_fact.QUANTITY] * [Measures].[Adjusted Price]
Select "Adjusted Sales Revenue" as the Measure for the Gauge Component
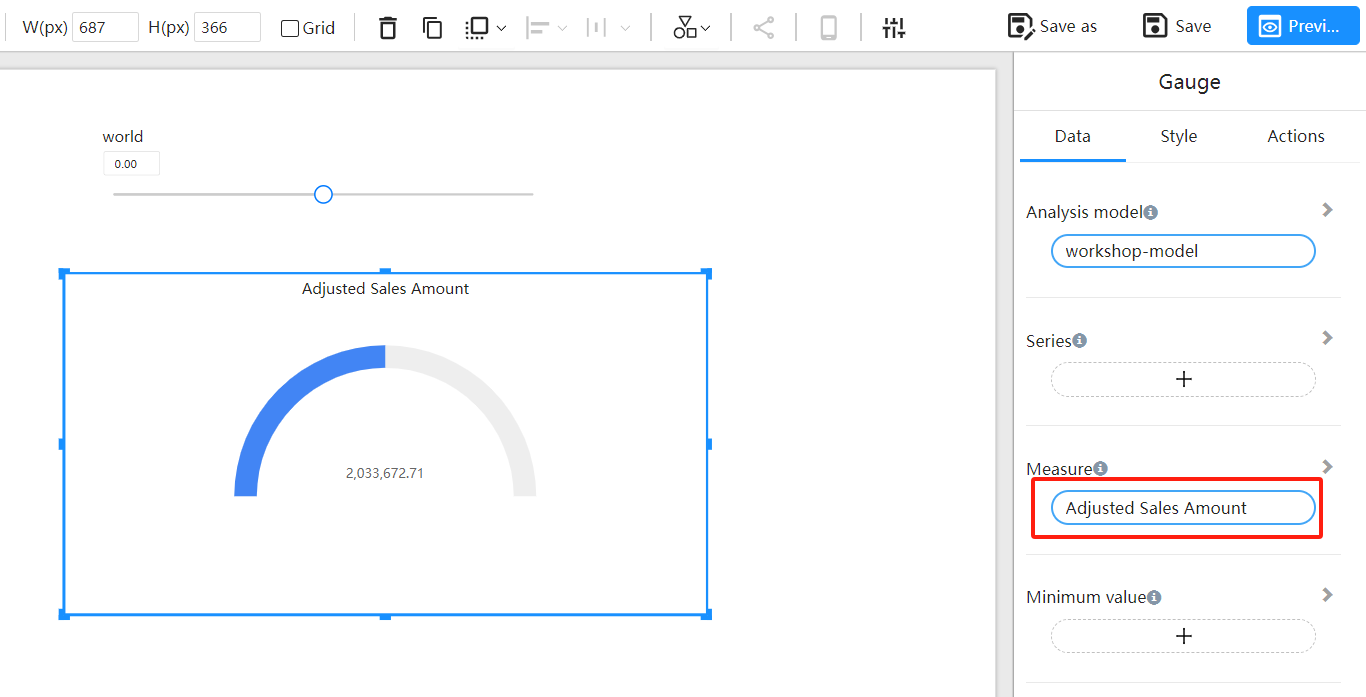
- Adjust the dashboard component's style by setting the Minimum Value (0) and Maximum Value (3000000).
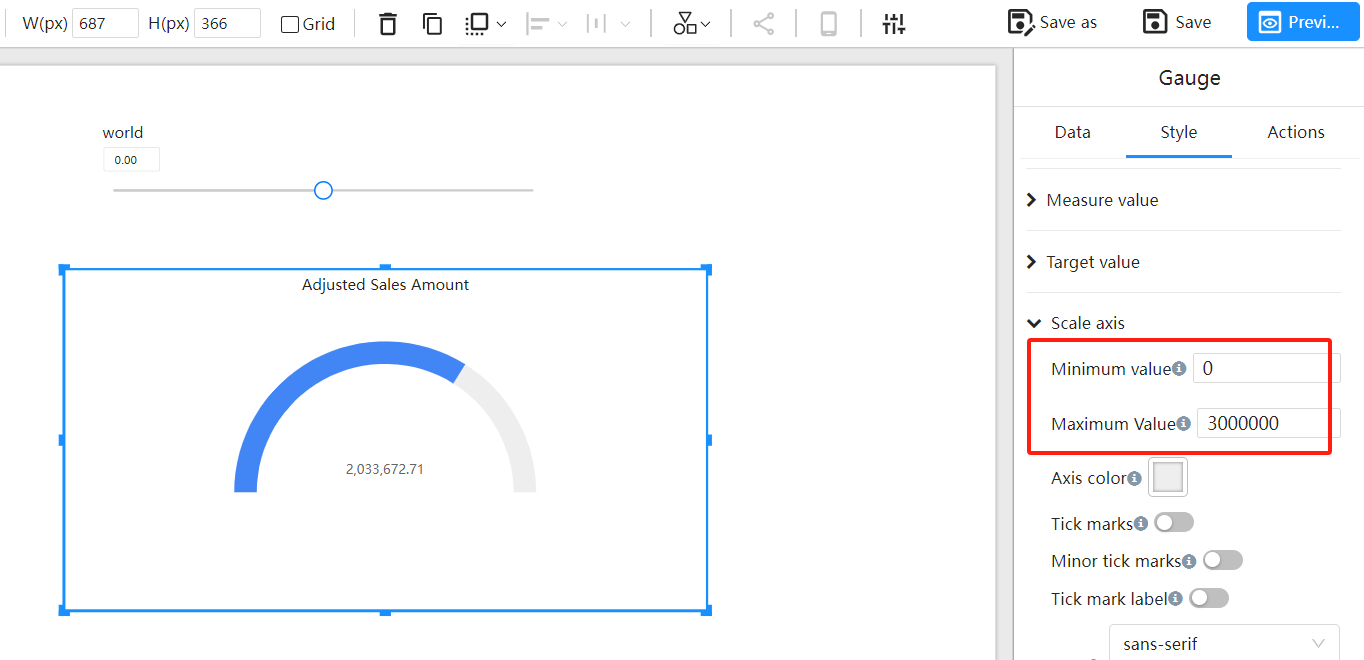
Interactive Analysis
Adjust the "Price Adjustment Percentage" parameter to dynamically view changes in Adjusted Sales Revenue under different price adjustment scenarios.
